SaaS Marketing Metrics: 9 KPIs Every Team Should Track
If there’s one thing marketing teams aren’t short on, it’s data. In some ways, this can be too much of a good thing.
There are now so many SaaS marketing metrics to track that it can become difficult to distinguish which are really worth your time. Your team can’t keep on top of them all – so which provide the most useful insight?
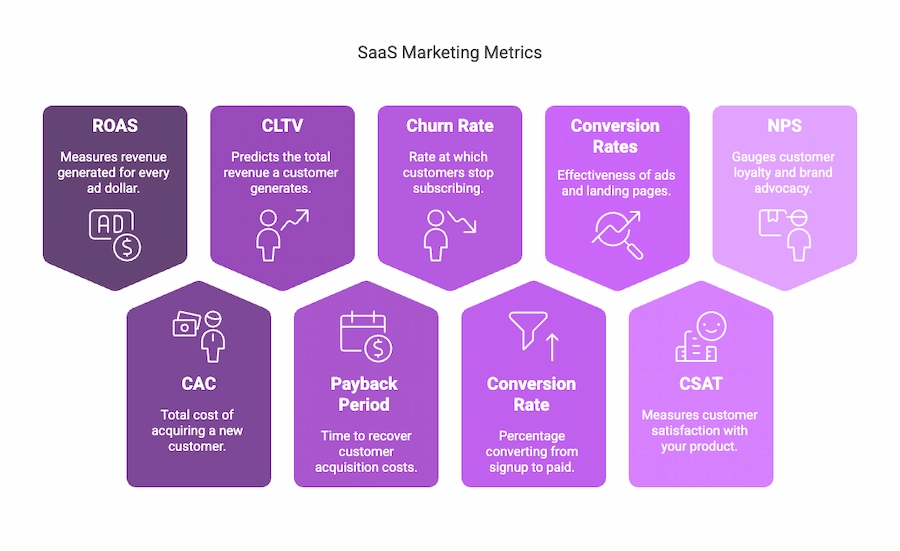
In no particular order, here are our top 9, specifically picked for the needs of SaaS businesses.
Velocity’s Top SaaS marketing metrics
1. ROAS (Return on Ad Spend)
What it is
The return on the amount you spend on advertising – in other words, how much revenue your ad campaigns generate for every dollar you put in.
How to measure it
Divide the amount of direct revenue from ads by your total ad spend, then multiply by 100 to give a percentage.
Ad spend is direct ad spend only. Save your other costs (software, employee time etc) for a more general ROI calculation.
For example:
Ad revenue (sales and close deal value from ads): $15,000
Ad spend (Google Ads): $3,000
ROAS: 15,000/3,000 x 100 = 500%
Why it’s important
Tracking your ROAS is a great way to gauge the overall performance of your ad campaigns – whether you’re reaching the right audiences, which platforms are the most lucrative, and where you could optimize your campaigns for a better return.
As a SaaS business, you should be shooting for a 300% ROAS at least if you want to cover your costs and generate some profit on your campaign.
2. CAC (Customer Acquisition Cost)
What it is
The total amount you spend on sales, marketing, and onboarding per new customer.
How to measure it
Divide your total spend on sales and marketing activities by the number of new acquisitions over a set period of time.
Your total spend should take into account:
- Advertising spend across all platforms (online, print, out of home)
- Your teams’ salaries, commission, and expenses
- Marketing costs for activities such as content creation, email marketing, SEO
- Payment processing fees
- Software subscriptions
For example:
Total spend: $25,000
New customers: 500
CAC: $25,000/500 = $250
Why it’s important
Tracking CAC helps you ensure your marketing strategy is sustainable long term, and allows you to make informed decisions about pricing, marketing channels, and customer segments to build healthy profit margins.
Because SaaS businesses generate revenue via a subscription model, the amount of time it takes to recoup your CAC can be lengthier. Keep CAC low by prioritizing targeted, cost-effective marketing channels so that CAC doesn’t eat up too much of your working capital.
3. CLTV (Customer Lifetime Value)
What it is
The average amount of revenue your customers generate, from their first engagement until the time they end your relationship with you.
How to measure it
For a benchmark average, multiply your average customer value by your average customer lifespan.
For example:
Average customer value: $300 p/m
Average customer lifespan: 36 months
Average CLTV: $300 x 36 = $10,800
You can work this out for each customer by using their specific value rather than an average.
Why it’s important
Knowing how much revenue you can expect your customers to generate helps you make key strategic decisions around product pricing and budget allocation.
You can also use CLTV in conjunction with CAC to make sure that you’re seeing a return on the amount you spend attracting new business. A ratio of 3:1 (CLV:CAC) or higher indicates that you’re seeing positives here.
4. Payback Period
What it is
How long it takes for your business to recoup money spent on acquiring new customers (CAC) in revenue.
How to measure it
Divide your CAC by the average amount of revenue generated per customer per month.
For example:
CAC: $250
Average per month revenue: $25
Payback period = $250/$25 = 10 months
Why it’s important
Your payback period provides a useful break even point for customers. If anyone jumps ship before this point, you’ve lost money acquiring them; if they pass it, they become profitable.
Tracking and reducing your payback period also helps with cash flow – if your payback period is too long, you’ll have less capital available to use elsewhere in your business.

5. Churn Rate
What it is
The percentage of customers that end their relationship with your business in a given time period.
How to measure it
Divide your lost customers by your new acquisitions, then multiply by 100 for a percentage.
For example:
Lost customers: 200
New customers: 1000
Churn rate: 200/1000 x 100 = 20%
Why it’s important
Due to the subscription model, SaaS businesses don’t typically capture a huge amount of revenue on a customer’s initial sign up. A customer’s value lies in their potential for an ongoing relationship with their SaaS provider.
Unfortunately, the subscription model also makes it easier than ever for customers to switch providers as soon as they’re dissatisfied with your service.
Tracking churn rate helps you maintain your revenue streams and react to any surges in customers leaving your business. This could include upgrading and expanding your feature set, offering more competitive pricing, or investing more in customer support.
6. Signup to Paid Conversion (Free Trial Completions)
What it is
The percentage of free trial signups that become paying customers.
How to measure it
Divide the number of paid conversions by total free trial signups, then multiply by 100 to get a percentage.
For example:
Total paid conversions: 10
Total free trial signups: 100
Signup to paid conversion: 10/100 x 100 = 10%
Why it’s important
Many SaaS businesses track free trial sign ups as an indicator of sales success. Whilst this is useful in some respects, its value is limited on its own – all it is a measure of your sales team’s ability to give away free stuff.
By taking conversion into paying customers into account as well, you get more insight into overall product/market fit, and whether your ad campaigns are targeting the right audiences.
7. Ad and Landing Page Conversion Rates
What it is
The percentage of landing page visitors/ad viewers that turn into leads.
How to measure it
Just open your chosen analytics tool – all of them track conversion (plus a range of other useful metrics) in real time.
Why it’s important
Your online ads and landing pages’ conversion rates are the most direct reflection of your marketing campaign success – and (good news) also one of the easiest to optimize.
This means there’s a lot of potential for quick wins here. Tweak your targeting, refine your ad copy, or A/B test different ad formats to emphasize your product’s appeal and increase the number of quality prospects you attract.
8. CSAT (Customer Satisfaction Score)
What it is
A metric that allows you to quantify customer feedback and gauge how happy your customers are overall with your business, product, or service.
How to measure it
Ask your customers to complete a customer survey about their satisfaction with the product or service you are providing, with the following responses:
- Very unsatisfied
- Unsatisfied
- Neither satisfied or dissatisfied
- Satisfied
- Very satisfied
To calculate your CSAT score, divide your number of ‘satisfied’ and ‘very satisfied’ responses by your total responses – then multiply by 100 to get a percentage figure.
For example:
Positive responses: 100
Total responses: 500
CSAT = 100/500 x 100 = 20%
Why it’s important
CSAT is a useful indicator of your potential to retain customers. If you see your CSAT score dipping, it’s worth following up with your customer base to see what you could improve.
You can also use CSAT surveys to track customer reaction to any changes you make to your product or service offering – you might run one each side of a major product update, for example.
9. NPS (Net Promoter Score)
What it is
A measure of how likely your customers are likely to recommend your product to a friend or colleague.
How to measure it
Ask your customers to complete a quick, one question survey: ‘On a scale of 1-10, how likely are you to recommend this product to friends or colleagues?’
- Customers who score you 9 or 10 are your promoters
- Customers who score you 7 or 8 are neutral
- Customers who score you 6 or below are detractors
To calculate NPS, you ignore neutral customers, then subtract the % of detractors from the % of promoters.
For example:
Your survey returns 60% promoters and 20% detractors.
NPS: 60% – 20% = 40%
Why it’s important
There’s no marketing like free marketing – and not just because you’re saving money. Recommendations from trusted contacts frequently top lists of why customers choose one particular product over others.
A high NPS indicates opportunities to use this to your advantage. Reach out proactively for testimonials and online reviews, and introduce customer referral bonuses when the time is right.
SaaS marketing, supercharged
At Velocity PPC, we’re all about building customized Google Ads campaigns that maximize the amount of leads you generate per dollar spent.
With thousands of dollars of campaign spend behind us and years of experience with SaaS clients, we know what works.
If you want to find out more about how our services could transform your SaaS marketing campaigns, get in touch today for a quick chat.